
Inflation is mostly oil prices: US edition
Inflation is mostly oil prices: US edition
Correlation may not be causation, but having a leading indicator is nice

The CPI-U for last month is out, it’s up 6.2% on a year ago, and we are flipping our lids. The Financial Times: “US consumer prices rise at fastest pace in three decades”. Reuters: “Wall St falls as hot consumer prices data fuels inflation worries”. CNBC: “U.S. consumer prices jump 6.2% in October, the biggest inflation surge in more than 30 years”. Then, of course, there’s the slew of verified Twitter accounts:


And I just saw Noah Smith elsewhere on Substack amping up the excitement by pointing out that the month-on-month inflation rate of 0.6% “is a 7.4% annualized rate”. Yow!
It’s true that the US is seeing higher inflation than in recent memory (it’s like there’s a once-in-a-century pandemic or something). Does that mean hyperinflation’s coming? Is everything going to change? Should we all run outside into a thunderstorm and shake our fists in the direction of the White House while screaming “curse you, Joe Biden!”?
Probably not. I’ve shown that I’m not an uncritical Joe Biden fan, and it’d be nice to get to blame Biden for another thing, but I doubt this is his fault. Inflation has a ready non-Biden explanation: oil prices.
Yes, that’s reductive, and I don’t think changes in oil prices explain all inflation. At the same time, oil prices have a long tradition as an explanation of inflation, including a recent Oxford Institute for Energy Studies paper and a post from the Federal Reserve Bank of St. Louis’s FRED® Blog. And a positive relationship between oil prices and consumer prices makes mechanistic sense, since the production processes for many consumer goods and services ultimately need oil as an input somewhere.
I therefore don’t think I’m wasting my time by checking whether oil-price increases correlate with increases in the consumer price index (CPI), and the check is not difficult. FRED hosts time series of CPI and of crude-oil prices, specifically global prices of West Texas Intermediate and Brent crude oils, the two types of oil for which prices are most often quoted. I want to compare increases in the CPI with increases in oil prices, so I use the year-on-year percentage increase in CPI as my dependent variable. Most media commentary focuses on increases in the CPI-U instead, which represents “All Urban Consumers”; I don’t see why an urban-oriented index is the popular choice, so I’m using what appears to be the all-in index.
Spend a few minutes on FRED clicking around, overlaying the 3 time series (increases in each of CPI, WTI crude prices, and Brent crude prices), rescaling the CPI changes to be in basis points (so they aren’t crushed onto the horizontal axis by the bigger swings in oil prices), and one’s off to a fine start:

It may be a bit tricky to see given Substack’s limited column width, and it doesn’t help that the oil time series are half as long as the CPI time series, but something’s going on there. When oil prices are rising fastest, the CPI’s often rising quickly; when oil prices decline, CPI inflation’s more muted, occasionally negative.
I could play with this chart by cutting out the pointless left half (where the oil data are unavailable), and by translating and stretching curves vertically to improve their overlap, but that’s really sloppy, and I’m trying to be merely ordinarily sloppy. Better to download the 3 time series and upgrade to scatterplots and regressions. But before I make things more complex, I take the simplifying step of averaging the Brent and WTI crude-oil time series together. They track each other closely and I have no principled reason to treat them differently, so combining them on an equal footing is a nice simplification.
That leaves one dependent variable, year-on-year CPI inflation, and one predictor variable, year-on-year increases in crude-oil price, both available from January 1991 through August 2021. The natural choice of plot is a scatterplot:

Doesn’t look too bad, if I may say so. While I don’t really believe in the straight trendline, which over-predicts inflation when crude oil abruptly gets cheaper, there’s a clear positive relationship. In extremely rough terms, if crude prices are where they were last year, year-on-year CPI inflation is likely about 2%, and each 50-point increase on last year’s oil prices corresponds to about another point of CPI inflation.
Two improvements come to my mind right away. One is that it’d be more impressive to find that past oil prices correlate with later CPI, because showing that oil prices correlate with contemporaneous CPI might just reflect the CPI including prices of gasoline (which is basically just certain fractions distilled from oil). Another is that I should include a longer-term measure of oil prices. I don’t expect oil-price changes to feed through to the CPI only over a few days. As we’re learning from pandemic disruption, supply shocks can reverberate for weeks or months.
To make both improvements at once, I smooth the crude-oil price-increase time series with a moving average to make a new predictor time series: the mean of the previous n months of increases in crude prices, where I pick the value of n to maximize the correlation with the current month’s CPI inflation. (If you’re asking “Why not use an exponentially-weighted moving average?”, bear with me.)
The special case of n = 1 means replacing this month’s crude-price increase with last month’s. At least in this dataset, that actually improves the correlation between increases in CPI and in crude prices (from 0.61 to 0.67 with Pearson’s r, and from 0.63 to 0.68 with Spearman’s).
Trying every value of n up to 24 (seems a bit of a stretch to expect crude prices from over two years ago to leave a statistical imprint in current CPI) reveals that n = 1 produces the best Spearman’s rank correlation between crude-price increases and CPI inflation, while n = 2 produces the best Pearson product-moment correlation (r = 0.68). I go with the latter as I’d hope for something resembling linearity here.

OK, not so different, and still nonlinear. But a slight improvement, and I’ve now shown that global crude-oil prices work as a leading indicator of US-specific CPI.
Now to tweak the proof of concept. It’s a bit arbitrary to use an unweighted average of the past two months’ increases in oil prices as my index of oil-price change. It’s plausible that last month’s price increase matters more than the increase the month before that. That motivates putting more weight on later price increases (but still omitting the current month’s price increase, to ensure my oil-price index remains a leading indicator).
A natural approach is to pick a fraction f between zero and one, and give each month’s oil-price increase only f times as much weight in my oil-price-increase index as the following month’s increase. (This is the exponentially-weighted moving average you might’ve been wanting.) A lower f puts more weight on last month’s price increase over earlier months’ increases, a higher f puts more weight on all of the earlier price increases, and taking f all the way to one means putting equal weight on all past price increases.
Naively choosing f by simply picking 0.5, halfway between zero and one, isn’t bad, but picking the f that maximizes the correlation between my oil-price-increase index and CPI inflation (like when I picked n) is better. That optimal f is 0.42. (Meanwhile, I cheat a little bit by going back only 24 months to compute a month’s exponentially-weighted moving average, but that matters little thanks to the exponential decay in the weights. Oil-price increases in the distant past don’t much matter.) The resulting index of crude-price increases has a Pearson’s r of 0.75 with CPI inflation.
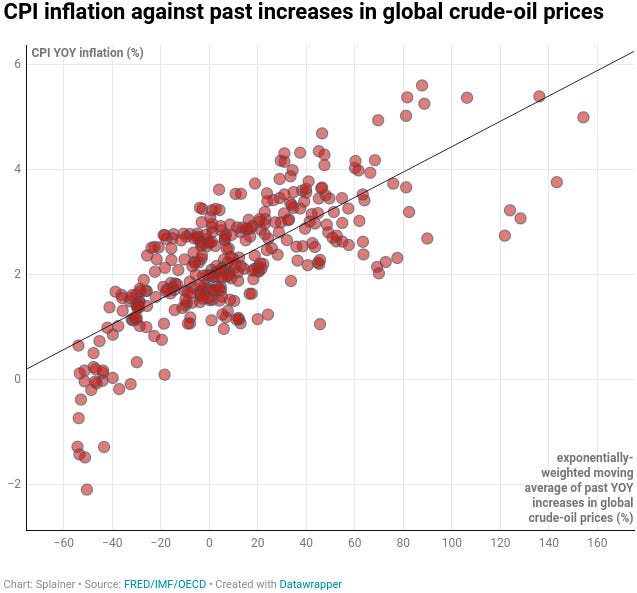
Again, a marginal improvement, but the improved correlation of 0.75 does imply that the exponentially-weighted moving average of past crude-price increases accounts for most of the variation in CPI inflation (square the correlation of 0.75). There it is: inflation is mostly oil prices. Past oil prices, at that!
Past oil-price increases are far from a perfect predictor of CPI inflation. The latest observation in the dataset is from August, when year-on-year CPI inflation was 5.3%, crude prices were up 59% on last year, and the exponentially-weighted moving average of crude-price increases was 92%. Going by that moving-average index, CPI inflation should’ve been only 4.2%, an under-prediction of 1.1 points. (Though as recently as June oil prices made an excellent prediction: in June CPI inflation was 5.4%, and the moving-average index of 132% implied CPI inflation of 5.3%.)
Nonetheless, I can use recent oil prices to venture an inflation prediction.
Oil prices boomed this year but a further year-long boom seems unlikely. WTI and Brent crude both peaked in price in mid-2008 at $134 per barrel, and they’re now at about $83 per barrel, most of the way to that all-time high. Another year of year-on-year price increases near 100% would break the all-time high. That could happen but other supply-chain issues are liable to block that.
I seriously doubt that the moving-average index in a year would be even 80%. Something like 40% seems more plausible. Going with that 40% guess, and it is a guess, the expected CPI inflation in a year is 3.0%. Lacking a feel for whether that’s too low or too high, I make a low-confidence guess of 3% for October 2022 CPI inflation.
I feel more confident (though still not certain!) in predicting that CPI inflation won’t be over 6% in a year. Noah Smith’s Substack post opens by warning that the more prominent part of “Team Transitory”, which essentially writes off recent inflation spikes as “purely due to transitory supply factors”, “is taking a serious shellacking”. Maybe, but if one trusts in the power of the it’s-just-oil model, little more is needed for CPI inflation to start shrinking. If CPI inflation sinking below, say, 4% counts as a win for Team Transitory, I wouldn’t count them out.
Update, November 18: I’ve removed an anachronistic Jack Dorsey tweet about hyperinflation from October that I’d thrown into the original post, and I’ve today seen an Intercept report from a week ago, “The Main Driver of Inflation Is a Murderous Maniac in Riyadh”. The Intercept article accepts the premise that oil prices matter to inflation, and goes further than my post by arguing that a key factor in current inflation is Mohammed bin Salman limiting Saudi oil output as revenge for Biden stigmatizing him and Democrats’ intermittent disapproval of the Saudi-UAE war in/on Yemen. Hey, maybe we kinda get to blame Biden after all!